 |
 |
|
| eNews • December 2016 | ||
| Promoting a Cost-Effective, Reliable and Competitive Transportation System |
||
 Production Growth, Overseas Competition Demands Transportation Investment
In the midst of another historic soybean harvest, U.S. farmers continue to demonstrate their ability to respond to growing demand from domestic and international customers. However, this increased production requires a corresponding increase in transportation capacity to ensure the industry, and the individual farmer, remain profitable. A recent study funded by the soybean checkoff offers warning that future production increases, along with infrastructure improvements by South American competitors, could suppress the profitability of the U.S. soybean industry.
“Transportation infrastructure gives U.S. farmers a significant competitive advantage over our international competitors, but without investment, we won’t enjoy that advantage for long,” said Mark Seib, a soybean farmer from Poseyville, Indiana, and director on the United Soybean Board. “We need to focus on investing in our infrastructure now to position ourselves for a competitive and profitable future.”
The study, “Farm to Market - A Soybean’s Journey,” is an expansion of the original 2012 report that highlights how soybeans are transported to domestic and international customers. In addition to documenting the volume of total U.S. soybeans transported across the various modes, the report provides transportation profiles of 26 individual states - an expansion from the 17 states featured in the 2012 study. The 26 states profiled account for 97 percent of soybeans transported in the country. The research was funded by the soybean checkoff and performed by Informa Economics.
Some of the key findings of the study include:
- Rail carloadings of soybeans will increase 20 percent to approximately 240,000 rail cars by the year 2023. Barge loadings will increase 32 percent to over 21,000.
- China, the leading international customer for U.S. soybeans, will continue to import larger volumes. China’s annual soybean net imports increased by 24 million metric tons (882 million bushels) from 2006 through 2010. From 2010 through 2023, Chinese soybean net imports are expected to increase an additional 74 million metric tons (2.7 billion bushels) to 126 million metric tons (4.6 billion bushels).
- Soybean production in Brazil, the second leading producer worldwide, is expected to exceed 129 million metric tons (4.7 billion bushels) by 2023, up from 87 million metric tons (3.2 billion bushels) in 2013.
- Exports of soybeans from Brazil will expand to exceed 74 million metric tons (2.7 billion bushels) in 2023 from 45 million metric tons (1.7 billion bushels) in 2013.
- Infrastructure improvements in Brazil are estimated to reduce freight costs between 20 and 30 percent or $40 per metric ton. Such an improvement would result in Brazil’s inland transportation costs to be nearly equivalent to those in the U.S.
In addition to providing a forecast for future production and transportation demand, the report provides data in the following areas:
- Status and outlook for the livestock industry - both nationally and in the 26 featured states
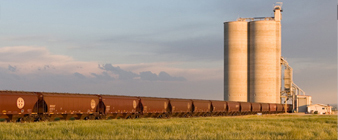
- Rail transportation: Number of carloadings; Average distance moved; Leading origination and destination areas; Capacity
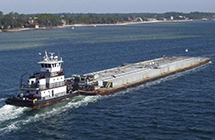
- Barge transportation: Percentages moved by various rivers; Commodities transported; Average distances moved per commodity; Capacity per barge
- Overview of current and future state of infrastructure development in Brazil
- Storage capacity - both nationally and in the 26 featured states
The full results of the study can be accessed at www.soytransportation.org or www.unitedsoybean.org.
Soy Transportation Coalition |
|